After Dark (Series):
Browse the series: After Dark
Previous: Solar Street Light Dimming: The Sun Does Not Follow Your Pathway
The renders are beautiful. The physics is not.
Look, I know this one is heavy on numbers and physics. I know you have three other tabs open and an inbox that never sleeps. But I implore you to read this, if not in one shot then in a couple of passes. It will help you, I promise. Possibly save you from a very uncomfortable conversation with a client.
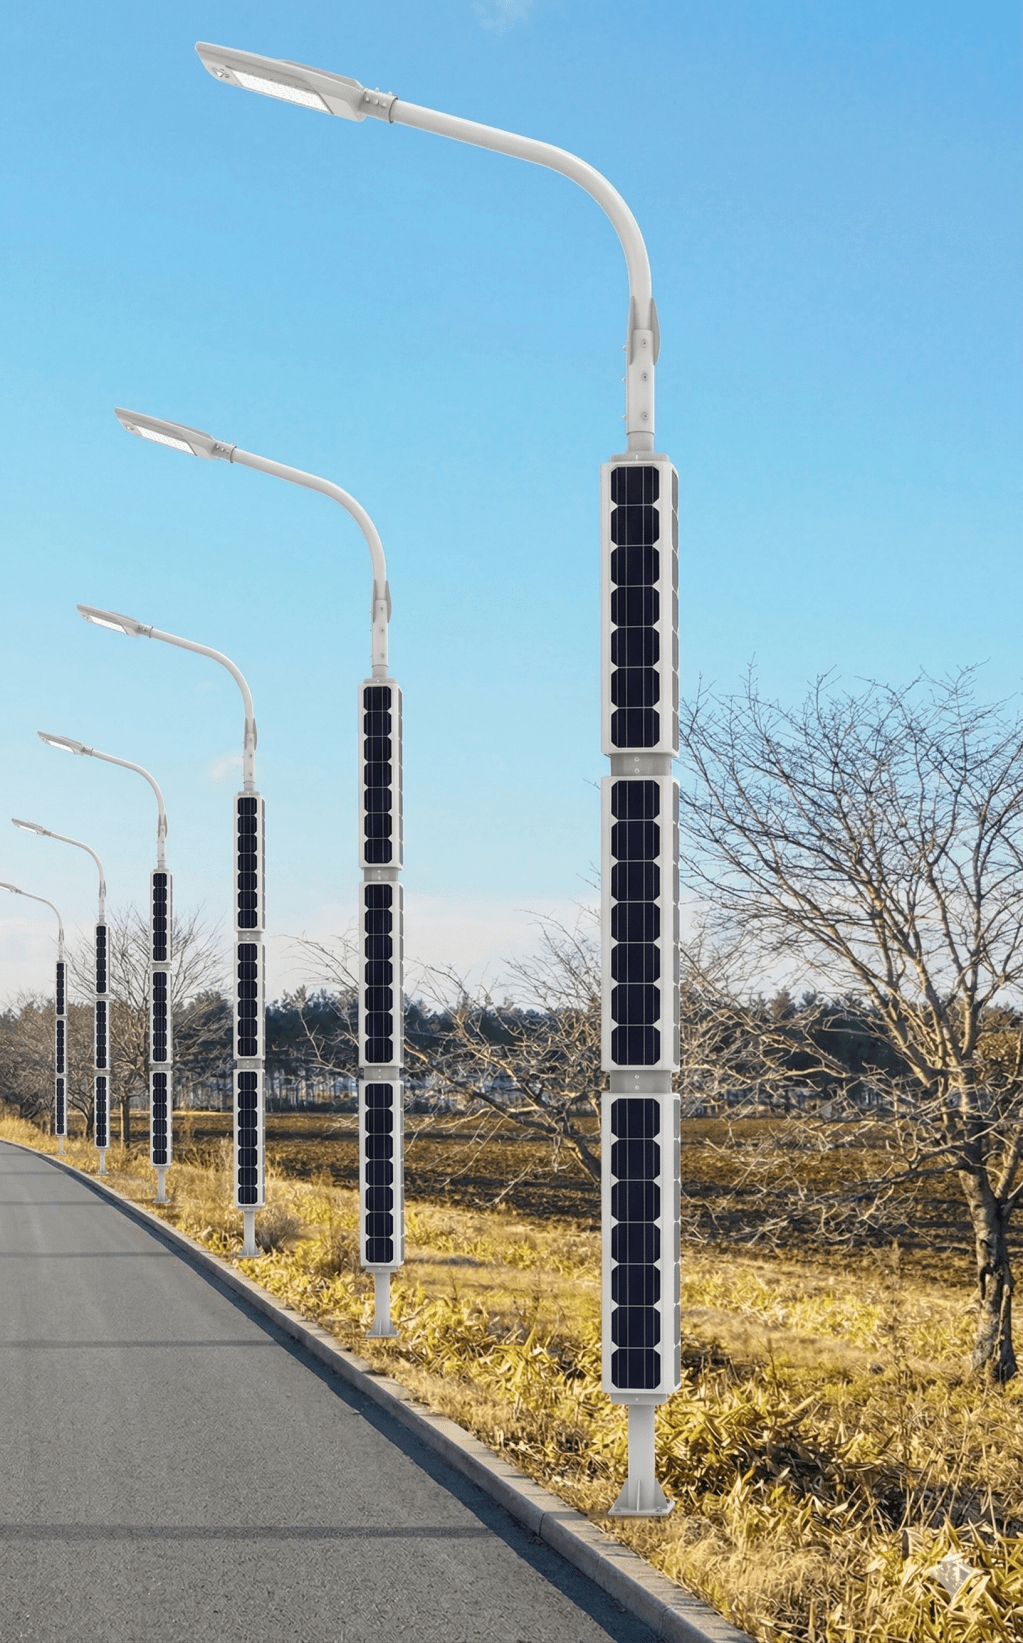
There is a product category in the solar street lighting market that looks like the future. Sleek cylindrical poles wrapped in solar cells, no flat panels sticking out at odd angles, no separate mounting hardware, just a clean integrated column of glass and metal that catches light from every direction. The renders are beautiful. The sales language is confident. But the physics of this design tells a different story entirely.
Cylindrical vertical solar poles are being marketed on the premise that their geometry is a performance advantage. The claim, in various forms across multiple manufacturers, is that wrapping solar cells around a cylinder allows fuller use of available sunlight, captures energy from more angles through the day, and delivers superior or equivalent results compared to conventional flat panel systems.
None of that survives contact with the cosine law of incidence.
This post is not an argument against solar. It is not an argument against innovative form factors or integrated pole aesthetics. It is an argument that geometry is not a marketing narrative. Physics does not negotiate with brochures. And when you run the actual numbers, verified energy models, real irradiance data, full loss chains, worst-month sizing, cylindrical solar poles consistently deliver between 35 and 76 percent less energy than their nameplate LED ratings require, depending on where you install them.
I ran the numbers for you. What I found should make anyone specifying these systems very uncomfortable.
What the Marketing Wants You to Believe
The pattern across cylindrical solar pole marketing is consistent. Phrases like “360-degree coverage for power generation,” “full use of the available sunlight,” “reliable power in every season,” and “unmatched performance in any climate” are designed to create a single impression: that wrapping cells around a cylinder is an energy collection advantage, not a packaging decision.
Some manufacturers go further. Cell efficiency figures above 23 percent are cited as proof of system superiority. Shade tolerance is presented as a binary difference between their product and conventional flat panels. “Sustained lighting” language implies the system delivers full rated output regardless of season or weather.
These are confident claims. They are also claims that no manufacturer has supported with a transparent, site-specific, worst-month energy balance. Not one. That absence is not an oversight. It is the most informative specification in their entire product literature.
What the Physics Actually Says
A photovoltaic cell generates power proportional to the irradiance incident on its surface multiplied by the cosine of the angle between the incoming radiation and the surface normal. This is not a manufacturer preference. It is a consequence of vector projection in three-dimensional space.
For a vertical cylinder, at any given moment, roughly half the cells are in shadow. The illuminated half faces the sun at angles ranging from zero degrees at the apex to 90 degrees at the edges. Integrating cosine of theta from minus 90 to plus 90 degrees and normalizing over the half-circumference yields an average beam factor of 1/pi, approximately 0.318.
Adding a conservative diffuse irradiance fraction of 0.40, which accounts for sky scatter that reaches cells on all sides, gives the composite geometry correction factor:
CF = 0.40 + (0.60 / pi) = 0.591
This factor is a hard physical ceiling. It applies to every cylindrical vertical pole regardless of size, cell efficiency, or manufacturer. Wrapping higher-efficiency cells around the same cylinder does not change it, because nameplate watt-peak already normalizes for cell efficiency. This is not a design flaw that engineering can solve. It is geometry.
Cylinders also run hot. Cells wrapped tightly around a pole trap heat. Using a thermal model of ambient temperature plus 38 degrees C during charging hours, and a temperature coefficient of minus 0.40 percent per degree C relative to 25 degrees C, December cell temperatures in Orlando reach approximately 54 degrees C. That is an 11 percent thermal penalty on top of the geometry loss. In summer the penalty reaches 16 percent. Ventilated flat panels typically operate 8 to 10 degrees cooler, preserving roughly 3 to 4 percentage points of output that cylindrical systems permanently lose to heat.
The full loss chain from installed watt-peak to usable LED energy looks like this: cylindrical geometry factor 0.591, temperature derate December Orlando 0.888, PV manufacturing and soiling derate 0.90, MPPT and wiring efficiency 0.95, battery round-trip efficiency 0.90, LED driver efficiency 0.92. Combined, a cylindrical system delivers approximately 37 percent of its nameplate watt-peak rating as useful LED energy in December in Orlando. A properly tilted flat panel delivers approximately 66 percent. For every dollar of solar hardware installed, the cylindrical configuration delivers barely more than half the useful energy a flat panel provides.
Four Cities, One Formula, No Surprises
The worst month is the only month that matters for sizing. A solar lighting system must perform on the worst night of the year. Annual averages and summer performance figures are engineering distractions.
Using HOMER-verified irradiance data for Orlando and NSRDB TMY vertical surface data for the remaining cities, with CF = 0.591 and the full loss chain applied consistently, here is what a 260 Wp cylindrical single-head system can actually sustain continuously through a December night at zero percent unmet load:
City Dec G vertical kWh/m2/day Night hours Supported continuous watts Rated LED watts Deficit
Orlando FL 3.20 13.0 23.6 W 40 W 41%
Chicago IL 2.00 15.0 13.7 W 40 W 66%
Toronto ON 1.70 15.5 11.4 W 40 W 71%
Winnipeg MB 1.75 16.0 9.6 W 40 W 76%
Orlando is not a conservative choice. It is one of the best solar sites in North America. A 260 Wp system there cannot continuously power its own 40-watt nameplate LED through a December night. In Toronto, a city where multiple manufacturers are actively selling these products, the same system delivers 11.4 watts. The marketing says reliable power in every season. The math says 71 percent short in December in your own market.
Winnipeg is not a fringe data point. It is 9.6 watts from a 260 Wp system. That is the number for the country where “unmatched performance in any climate” and “built to endure the harshest Canadian winters” are written on the product page.
The Cell Efficiency Argument Does Not Help
Some manufacturers cite cell efficiencies above 23 percent as evidence of system superiority over competitors. This comparison is between Standard Test Condition lab measurements. It has no bearing on system energy yield per installed watt-peak in a cylindrical deployment.
Nameplate watt-peak already normalizes for cell efficiency. A 260 Wp module with 23 percent cells and a 260 Wp module with 18 percent cells deliver identical energy per installed Wp under the same irradiance conditions. The higher-efficiency version simply uses less physical area to achieve the same Wp rating. The geometry factor of 0.591 applies to both, identically, per Wp. A 28 percent cell efficiency advantage does not close a 41 to 76 percent energy deficit. It does not come close.
Where These Systems Can Still Make Sense
This is not an argument that cylindrical solar poles are worthless. They have real and legitimate applications. Aesthetic integration in civic or commercial spaces where loads are small and managed, remote IoT nodes like cameras, sensors, and monitoring equipment with 5 to 20 watt intermittent draws, parks and trails in sunbelt regions during summer peak use seasons, and sites where flat panel mounting is structurally impractical due to wind loading or space constraints.
These are real applications with real demand. They are also a much more modest claim than the marketing makes. The cylindrical form factor has packaging advantages. Low wind profile, integrated aesthetics, vandal resistance, and trench-free installation are legitimate differentiators. None of them are energy performance claims.
The problem is not the product. The problem is the gap between what the product is good at and what the marketing implies it can do.
What to Require Before You Specify One
If you are evaluating cylindrical solar poles for a real project, these are the minimum requirements before a specification is written:
• A site-specific worst-month energy balance with full loss chain documented, including geometry factor, thermal derate, battery round-trip efficiency, and LED driver efficiency
• Vertical surface irradiance data from NSRDB or NASA POWER for the project location, December monthly average, not annual average and not horizontal GHI
• Night hours for the project latitude in December, not a generalized autonomy figure
• Actual supported continuous LED wattage at zero percent unmet load for the design month, not nameplate LED wattage from a marketing sheet
• A clear statement of whether the system meets load through dimming, smart controls, or actual energy production, because those are not the same thing
• Battery sizing verified against the supported wattage above, not the nameplate LED rating
If a manufacturer cannot or will not provide a worst-month energy balance for your project location, that is the answer.
Three Questions Worth Asking
• If your system delivers “reliable power in every season,” can you provide a December worst-month energy balance for Toronto showing zero percent unmet load at the rated LED wattage?
• Your specification sheet lists a daily solar production figure for each model. What location, latitude, and seasonal basis was used to calculate it?
• “Sustained lighting” achieved through power reduction is load curtailment, not energy performance. At what percentage of rated LED output does the system operate in December in a northern climate?
Closing Thought
The cylindrical solar pole is a packaging innovation marketed as an energy innovation. Those are not the same thing, and the difference matters most at the worst moment, in the field, with a client standing next to you.
Sources
• NREL PVWatts Calculator, pvwatts.nrel.gov
• NSRDB National Solar Radiation Database, nsrdb.nrel.gov
• NASA POWER Project, power.larc.nasa.gov
• NREL Module Energy Rating and the Effect of Irradiance and Temperature
• HOMER Energy Modeling, Orlando FL, vertical 90 degrees, TMY irradiance data
• IEC 61724-1 Photovoltaic System Performance, Part 1: Monitoring
Quick FAQ
Q: Does the cylindrical geometry factor change with panel size or cell efficiency?
A: No. CF = 0.591 derives from the cosine law and the diffuse fraction. It applies per installed watt-peak regardless of physical size or cell technology.
Q: Does cold weather help cylindrical systems perform better?
A: Slightly, on the thermal derate. But reduced December irradiance and longer nights at northern latitudes more than cancel that benefit, as the four-city table shows.
Q: Can smart controls fix the energy deficit?
A: Smart controls can prevent blackout by reducing load. That is curtailment, not energy production. A system delivering 11.4 watts that dims to avoid shutdown is not delivering the specified illumination.
Q: What is the right data source for sizing a solar lighting system?
A: NSRDB for site-specific vertical surface irradiance, worst month only, not annual average. pvwatts.nrel.gov is the fastest verified tool for this.
About the Author
Piotr Mikus, MIES, is a roadway lighting designer and solar lighting specifier. He writes about solar street and area lighting standards, system sizing, and real-world performance at solarlightingnightshift.com.
Also in After Dark:
Solar Street Light Dimming: One Pole Is Dim, the Next Is Fine
Solar Street Light Shading: Why It Causes Early Dimming (and How to Prevent It)
Solar Street Light Energy Budget: Monthly Harvest vs Load, Autonomy, and Recovery
