On the Lighter Side of the Sun | By Piotr Mikus
After Dark (Series): Browse the series: After Dark link | Previous: previous post title and link
(What to demand in a solar lighting proposal before you believe its sizing):
- Every simplification named: irradiance basis, transposition model, albedo, shading, parasitic loads, battery model
- Parasitic loads listed in Wh per day, not buried in a margin
- Battery model stated: capacity in the cold, charge acceptance below freezing, round trip losses, aging
- Chronological simulation over the full weather record, not a design day
- An independent cross check with the differences reported
- Module and battery temperatures measured, and used to pick the thermal models
- Rerunnable inputs delivered with the submittal
A sizing sheet that fits on a napkin was probably done on one.
One Shortcut at a Time
Each one is small. That is how they get through.
Solar sizing has a sales problem hiding inside an engineering problem. Every input simplified makes the quote faster and the autonomy number fatter. Irradiance becomes one peak sun figure for the year. A tilted panel gets a factor from a table, with no transposition model and no albedo. Shading is assumed away. Parasitic loads vanish. The battery becomes a bucket: full capacity at 25 degrees and at minus 20, every watt in comes back out, every sunny hour accepted.
Real batteries do not read the quote. One published lithium iron phosphate sheet lists a charging window of 0 to 45 degrees Celsius. On a clear January morning at minus 15, the panel is producing and the battery refuses the energy. A bucket model books that harvest anyway. Capacity falls in the cold, round trip losses take their cut, and charge acceptance moves with temperature and state of charge. None of it fits on a napkin.
Parasitic loads get the same treatment. A controller listing under 5 mA of self consumption costs about 1.4 Wh a day at 12 V, small enough to skip. Add the battery management system, the communications modem, sensor standby and cutoff hysteresis, and the total runs around the clock while the sun works a few hours. The blind study’s loss tables show the same instinct in professional PV software: plant auxiliary consumption defaults to zero or has no input at all in six of seven tools.
What the Blind Test Added
Seven teams. Same data. Seven answers.
In 2023, seven commercial PV tools were run blind on identical inputs for two measured systems, 15.4 kW and 14.5 MW, each submitted by its own vendor. Four used the same named transposition model and landed 3.4 percent apart on annual irradiation, because albedo, solar position method and air mass sat undisclosed in front of the equation. Default derates ran from 0 to about 11 percent, and the energy each team promised tracked its derate in a straight line. After correcting for derates, the spread was still 6.0 percent at the 14.5 MW plant.
Specialist teams built those tools, and they still disagreed. The study covered grid PV: no batteries, no off grid load, no winter at 50 degrees north. A solar light sheet gets none of that scrutiny. Nobody ran its battery model blind.
The Stack That Belongs in a Sizing
Chemistry, math and physics. Yes, all three.
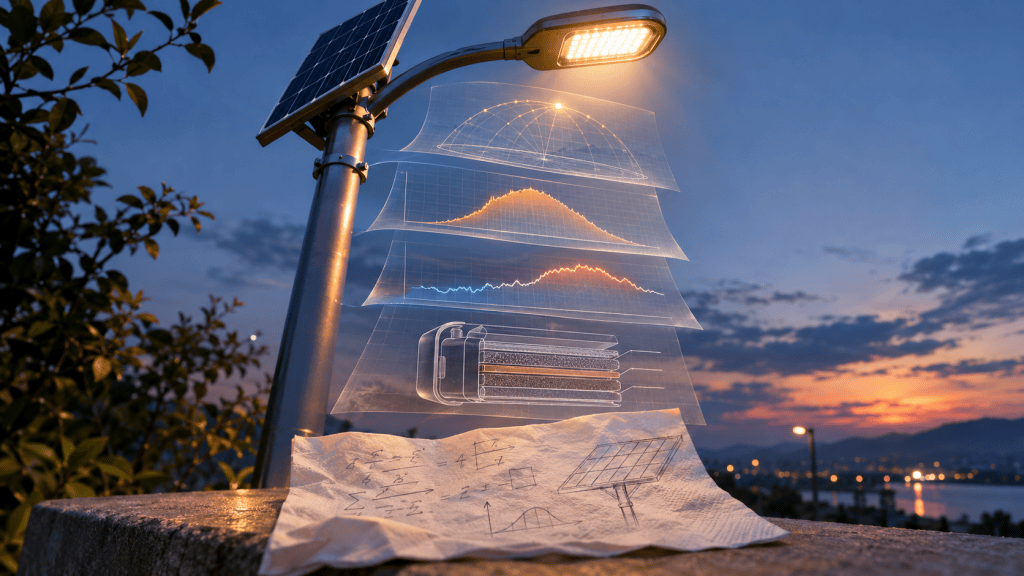
Sizing a solar light is design work, and the tools exist. A defensible stack, with each stage chosen by measurement and not by habit:
- Solar position and daylight: the NREL Solar Position Algorithm, adopted after testing
- Splitting global horizontal into beam and diffuse when the components are missing: DIRINT against Erbs-Driesse, compared with measured components
- Irradiance on the tilted panel: Perez-Driesse and Hay-Davies, both benchmarked
- Panel temperature: Faiman, SAPM and a transient model, selected against measured module temperatures
- PV output: PVWatts v8 to start, a single diode model once the detail is justified
- Battery and aging: a temperature aware energy model first, then a full degradation simulation, two levels of fidelity
- Reliability: continuous chronological simulation over the full weather record, with unmet load reported from it
- Verification: independent tools, HOMER Pro among them, run separately from the model under test, with the differences reported
In the proposals I review, almost none show any of it. A napkin, a pencil and a peak sun figure carry most of them. Solar is never the problem here. The napkin is.
What to Require in a Specification (Especially for Solar)
If the method is not on the page, it was not used.
- Irradiance chain written out: weather source and years, solar position method, beam and diffuse split, transposition model, albedo
- Shading source for every pole near obstructions
- Parasitic loads itemized in Wh per day
- Battery model described: capacity versus temperature, charge acceptance below freezing, round trip efficiency, aging assumption
- Panel and battery temperature model, with the measured data that justified it
- Chronological results across the full weather record, with unmet load reported
- Independent cross check, differences listed
- Rerunnable inputs with the submittal
Three Questions That Expose a Napkin
Short questions. Long silences.
Which transposition model, albedo and weather file produced the harvest, and can I see them in writing?
How does the battery model treat charging below freezing, capacity in the cold and round trip losses?
Which parasitic loads are in the budget, in Wh per day, and which independent tool reproduced the result?
If the answer is a peak sun number and a smile, the sizing is a sketch.
Closing Thought
You would not build a bridge from a napkin. Somebody is lighting a roadway from one.
Sources and Where to Verify
- Deville L., Anderson K.S., Sutterlueti J., Chambers T.L., et al. Feature review of photovoltaic modeling software utilizing blind performance assessment. Solar Energy, 2025. DOI 10.1016/j.solener.2025.114207 (3.4 percent irradiation spread among implementations of one named model, default derates, plant auxiliary and night loss defaults in Table 8, 6.0 percent spread at 14.5 MW)
- Reda I., Andreas A. Solar position algorithm for solar radiation applications. Solar Energy 76, 2004
- Perez R. et al. Modeling daylight availability and irradiance components from direct and global irradiance. Solar Energy 44, 1990
- Hay J., Davies J. Calculations of the solar radiation incident on an inclined surface. Proceedings of the First Canadian Solar Radiation Data Workshop, 1980
- King D., Kratochvil J., Boyson W. Photovoltaic Array Performance Model. Sandia National Laboratories, 2004
- Prilliman M., Stein J., Riley D., Tamizhmani G. Transient weighted moving average model of photovoltaic module back surface temperature. IEEE Journal of Photovoltaics 10, 2020
- Published lithium iron phosphate battery datasheet, charging temperature window of 0 to 45 degrees Celsius
Piotr Mikus is a roadway lighting designer and specifier focused on solar powered street lighting and controls.
Quick FAQ
Is simple sizing always wrong? No. A simple first pass is fine, and PVWatts v8 starts simple on purpose. The problem starts when the first pass gets printed as the final answer.
Why does a PV software study matter for a solar light? It shows professional tools disagree on grid PV once assumptions go unstated. A solar light adds a battery and cold weather, which the study did not test, so the exposure is larger.
What should I request from a vendor? The model stack by stage, the parasitic load budget, the battery model, chronological results with unmet load, and an independent cross check.
Continue reading the series: After Dark link

