After Dark | By Piotr Mikus
After Dark (Series): • Browse the series: https://solarlightingnightshift.com/category/after-dark/ • Previous: Five Days of Autonomy, Full Charge Not Included https://solarlightingnightshift.com/2026/06/08/five-days-of-autonomy-full-charge-not-included/
(What to demand in a solar street lighting proposal when the irradiation math is on the line):
- The irradiation source named: NASA POWER, PVGIS, SolarGIS, or other
- Whether the input is plane-of-array (POA) or global horizontal (GHI)
- Whether the peak sun hours value is an annual average or a worst month
- Whether the design is a static formula or a sequential hourly simulation
- Unmet load reported in hours dark per year, with the design target stated
- The night-hours and system-efficiency values used in the formula
- Worst-month and worst-event behavior, not just the annual average
The fight in solar sizing is almost never about the data. NASA POWER, PVGIS, and SolarGIS will all hand you a defensible irradiation number. The fight is about what you do with it next.
The Databases Are Not the Problem
Three satellites, three databases, one fairly boring agreement: the sun does roughly what it has always done.
NASA POWER, PVGIS, and SolarGIS are all credible sources of plane-of-array and global horizontal irradiation. For a given site they land close together. The data is not where designs go wrong. The trouble starts with which single number you yank out of the dataset and how you use it. Annual average POA peak sun hours, worst-month POA, annual average GHI, worst-month GHI. Every one is real, every one comes from a legitimate tool, and every one is a different number.
Why Averaging Works on the Grid and Fails Off It
A grid-tied solar plant sells kilowatt-hours by the year. A solar streetlight sells hours of light by the night.
Average peak sun hours is a perfectly sound metric for grid-tied solar power plants. Those systems generate electricity and feed it straight to the grid. No battery, no storage, no nightly delivery obligation. Revenue is measured in cumulative kilowatt-hours over months and years. If a cloudy Tuesday produces less, a sunny Thursday makes up the difference, and the average settles out over the billing period. The averaging is appropriate because the output itself is a cumulative number. That is what the metric was built for, and it does that job well.
Off-grid solar lighting is a completely different problem. The system must collect energy during the day, store it in a battery, and deliver it through that specific night. Every night is its own exam. A cloudy Tuesday does not get bailed out by Thursday because the load ran Tuesday night whether the panel was ready or not. Using an averaged PSH to size a system that must deliver nightly is applying a cumulative tool to a sequential problem. The math works when you are selling kilowatt-hours to the grid. It stops working the moment you have to store those kilowatt-hours in a battery and spend them before sunrise.
Reverse the Formula and Watch It Spread
Pick the input, and the formula will happily tell you the system is bigger than it is.
The standard industry formula sizes the panel for a known load. Reverse it and it tells you the load a given panel can support: Max Load equals PSH times panel watts times system efficiency, divided by night hours. Pin the hardware down at a 205W derated panel, 0.85 system efficiency, and 11.7 night hours for Atlanta. The only thing that moves is the peak sun hours value you feed it.
| Sizing method | PSH used (h/day) | Daily Wh harvested | Max load claimed | Overstated vs simulation (30W) |
| A: Annual avg POA PSH | 4.786 | 834 Wh/day | 71W | +138% |
| B: Worst-month POA PSH | 2.816 | 491 Wh/day | 42W | +39% |
| C: Annual avg GHI | 4.533 | 790 Wh/day | 67W | +124% |
| D: Worst-month GHI | 2.358 | 411 Wh/day | 35W | +17% (closest, by accident) |
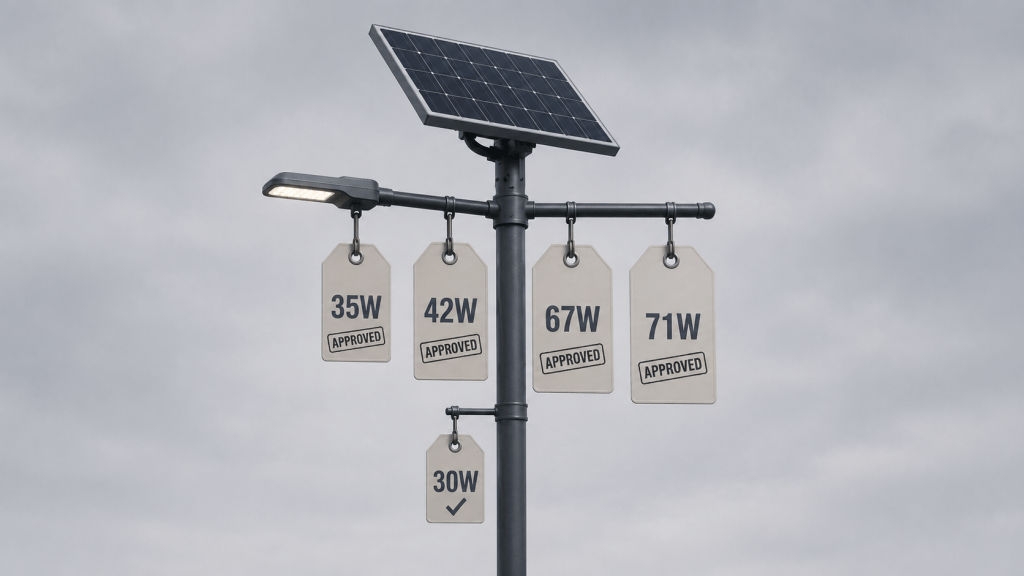
Same panel, same battery, same city. The answer swings from 35W to 71W on nothing but which legitimate number you grabbed. Nobody used bad data. They used four different right numbers and ran the same formula. One of them nearly doubles the light. All four think they are correct.
What the Formula Cannot See
Nobody has ever lived an average day. The battery does not get to either.
The formula is arithmetically perfect and does exactly the job it was built for. It just runs on an average, and averaging erases the order of events. It cannot see consecutive cloudy days, the charge that never came back between storms, cold-temperature battery lockout, or the gap between a mean day and a brutal one. Annual average POA pretends every day is the mean. Worst month is more honest but still treats every day in the month as identical and still assumes a full battery to start. Not one of the four methods tracks state of charge through time. That is the exact thing that turns the lights off, and the formula is blind to it.
Same Hardware, Hour by Hour, Nowhere to Hide
Run the year hour by hour and the panel stops being a slogan and becomes a number you can defend.
Feed 8,760 hours of sequential hourly irradiation into a simulation that tracks battery state of charge every hour and reports unmet load, then size up until unmet load hits zero. On this exact hardware in Atlanta, the answer is 30W with zero hours dark all year. State of charge holds a tight band, with one deepest dip to 23.4 percent on December 23.
The annual average POA method would have blessed 71W on the same hardware, more than double what the simulation will stand behind. Worst-month POA waves through 42W, still 40 percent over. Only worst-month GHI lands close at 35W, and it gets there by accident, with no state-of-charge tracking underneath it. Three of the four would sign off on a system December has no intention of honoring.
Right Tool, Wrong Step
The database was never the weak link. The step where you crush a year into one number is.
This is not a case against NASA POWER, PVGIS, or SolarGIS. Pull POA from any of them and you are fine. The weak link is the next move: flattening a year of weather into a single peak sun hours value and running a static formula on it. Solar did not oversize the light. A method that cannot see consecutive cloudy days did. The data tool and the sizing method are two separate decisions, and a serious spec puts both on the table.
When the Formula Says Yes and RP-8-25 Says You Are Dark
The formula approved the design. RP-8-25 does not approve the dark.
This is where an oversized system stops being an engineering miscalculation and becomes a safety question. ANSI/IES RP-8-25 (2025), Part 1, Section 6.10.2 sets a hard floor: lighting on any roadway classification cannot be reduced below the lowest applicable criteria. Collectors, arterials, freeways, local roads: each has a defined minimum. That minimum must be maintained through the night. Not most of the night. Not until the battery runs low. Through the night.
When a static formula says this hardware supports 71W and the system is deployed with a 50W luminaire, the formula confirms the design with room to spare. The certification paperwork is issued. The lights are installed. Then December arrives, the sequential weather hits, and the battery cannot keep up because no one modeled the consecutive cloudy days the formula was never built to see. The lights go dark. Not dimmed. Dark. The roadway that was designed and approved to meet RP-8-25 criteria is now operating below its minimum. Every night the system fails to deliver is a night the roadway does not meet the standard it was specified against.
This is preventable. A sequential simulation would have flagged the mismatch before the first pole went into the ground. The formula was correct. The method was incomplete. A better method, run on the same data, would have shown that the hardware could only carry 30W reliably and the spec would have been written to match. That is the difference between a system that survives winter and one that looked good on the submittal but could not back it up.
Solar street lighting works when the sizing behind it is as rigorous as the safety obligation the roadway carries. RP-8-25 treats roadway lighting as a safety system with enforceable criteria. The specification should be able to demonstrate, with sequential simulation data, that those criteria are maintained through real weather conditions. That is what makes a solar deployment defensible, and it is what averaged PSH formulas alone cannot provide.
What to Require in a Specification
If the proposal gives you a wattage but not the PSH behind it, you are holding the answer with the homework torn off.
- The irradiation database named explicitly: NASA POWER, PVGIS, SolarGIS, or other
- Whether the input is plane-of-array or global horizontal, and the panel tilt assumed
- Whether the peak sun hours value is an annual average or a worst month
- Whether the design is a static formula or a sequential hourly simulation
- Unmet load in hours dark per year, with the design target named (zero is the right target)
- The night-hours and system-efficiency values used, so the formula can be checked
- Worst-month and worst-event behavior, including the date and depth of the deepest state-of-charge event
Three Questions That Expose the Method
Polite questions. The PDF usually cannot answer them.
Which irradiation database did you use, and is the PSH value annual average or worst month, plane-of-array or global horizontal?
Is this a static formula or a sequential hourly simulation, and what is the reported unmet load in hours dark per year?
On the worst month and the single worst event, what does battery state of charge reach, and is the load still served?
If a proposal can name the wattage but not the PSH basis behind it, the number is a guess in a lab coat.
Closing Thought
Good data run through an incomplete method still gives you a wrong answer with great confidence. The lights do not read the database. They read the battery.
Sources and Where to Verify
- NASA POWER hourly meteorological and solar database
- PVGIS, Photovoltaic Geographical Information System, European Commission Joint Research Centre
- SolarGIS solar resource and irradiation database
- NREL PVWatts (plane-of-array irradiance and performance ratio reference)
- HOMER Pro sequential simulation methodology (8,760-hour state-of-charge tracking and unmet load reporting)
- ANSI/IES RP-8-25 (2025), Part 1, Section 6.10.2 (adaptive lighting design considerations: minimum criteria floors by roadway classification, prohibition on reducing below lowest applicable criteria)
- IEEE 1562, Guide for Array and Battery Sizing in Stand-Alone Photovoltaic Systems
Piotr Mikus is a roadway lighting designer and specifier focused on solar powered street lighting and controls.
Quick FAQ
If NASA POWER, PVGIS, and SolarGIS agree, why do designs come out so different?
Because the divergence is not in the database. It is in which PSH value you pull, annual average or worst month, plane-of-array or horizontal, and whether you run a static formula or a sequential simulation.
What is the difference between POA and GHI peak sun hours?
GHI is global horizontal irradiance, measured on a flat plane. POA is plane-of-array, the irradiation actually hitting a tilted panel. POA is higher for a tilted panel and is the right input when the panel is tilted, which it always should be.
Why does the static formula oversize the system?
Because it runs on an averaged day and cannot track battery state of charge across consecutive cloudy days, so it never sees the failure that shows up in winter.
Continue reading the series: https://solarlightingnightshift.com/category/after-dark/
